


ST. PETERSBURG, Fla. — Over the years I’ve had people say to me things like, “I can remember when I was younger it being warmer/cooler on [insert holiday].”
In other words, it’s the common ‘water cooler’ talk about what we remember when we were younger about past weather.
So I figured let’s go back and look at the last 68 years of Thanksgiving data in Tampa. I found some interesting nuggets of information, but I also found some data you likely expect.
The not-surprising stuff
First, for what most of us would expect: Thanksgiving in Tampa is typically comfortable.
Over the past 68 years the most common high temperature on Thanksgiving day is in the 70s. The minority of time we’ll occasionally have a high on Thanksgiving in the 60s.
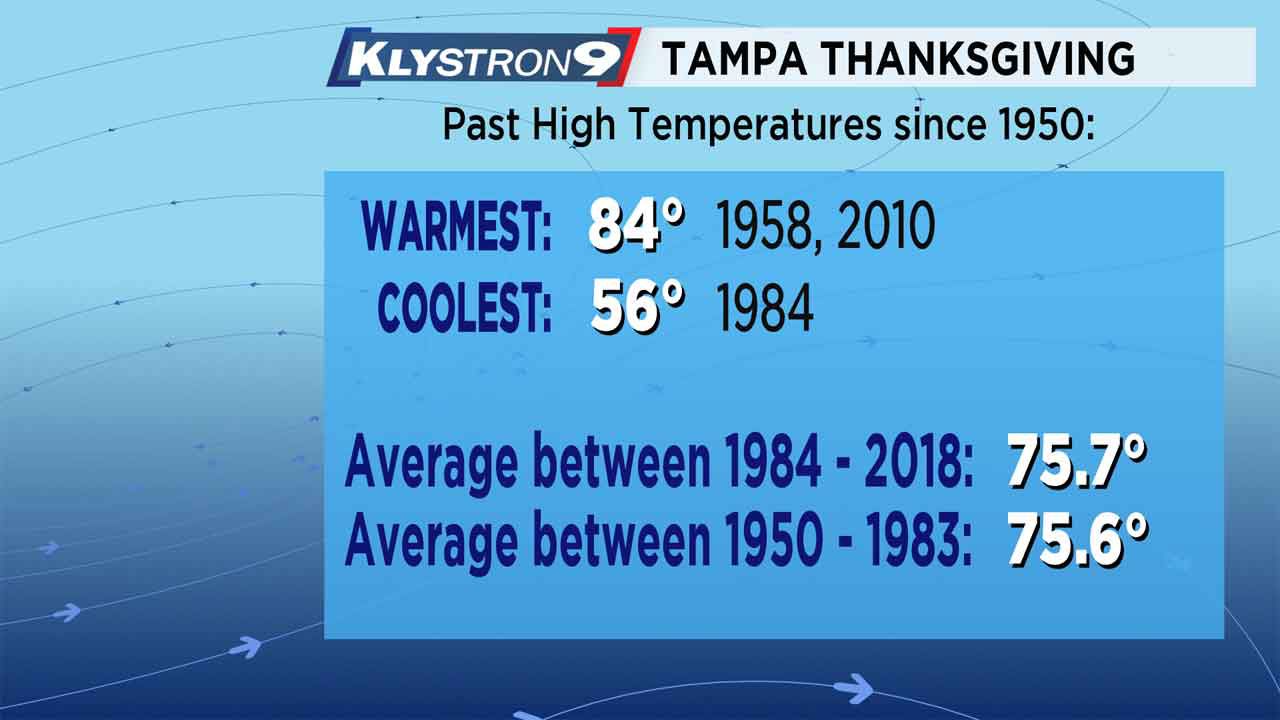
About 20 to 30 percent of the time we’ll have a high in the 80s. And only once in the past 68 years did we have a high in the 50s — that was 56 degrees in 1984.
Consistent regardless of other factors
Now for the interesting nuggets of info.
There didn’t appear to be any large correlation to weather patterns on what the temperature would be like at Thanksgiving. In other words, it didn’t seem to matter if there was an El Nino, or if it was a busy or calm hurricane season, or if there was a warm or cool October.
Each late November that I looked at had high temperatures that were all over the place, with 70s and 80s very common and occasional 60s sprinkled in. Since Thanksgiving doesn’t fall on the same date each year, I also assumed I would find a trend that the later Thanksgiving dates would show ‘cooler’ highs, but that didn’t seem to be the case.
There were numerous years where we had a cool snap just before Thanksgiving and then it was warm on Thanksgiving day. There were also numerous years where it was a little cooler for Thanksgiving, only to be back in the 80s a few days after.
Interesting decade trends
I took the average of all the Thanksgiving high temperatures from 1950 to 1983 and it came to 75.6 degrees. I then took the average from 1984 to 2018 and it came to 75.7 degrees. That’s amazing consistency!
So over the course of multiple decades you start to realize that the Florida climate is rather predictable and somewhat boring (that’s not a bad thing as that’s why so many of us love Winter in Florida). My main point is there didn’t seem to be long term trends veering away from the general average that were discernible for late November.
However, the most interesting nugget of information was there did seem to be decade trends. It might just be pure coincidence, or it could be that a deeper inspection of the data might show that large scale global patterns cause some decades to be a little warmer, while other decades to be a little cooler in Florida.
For example, I broke the numbers down by decade and found slight fluctuations. For each decade listed below is the average high for Thanksgiving during that ten year span.
- 1950 to 1959 was 74.2 degrees.
- 1960 to 1969 was 77.1 degrees.
- 1970 to 1979 was 74.7 degrees.
- 1980 to 1989 was 75.4 degrees.
- 1990 to 1999 was 78.3 degrees.
- 2000 to 2009 was 73.8 degrees.
- 2010 to 2019 was 76.7 degrees.
It could just be coincidence, but I found it interesting that each ten-year span alternated between increasing and decreasing by a little, and repeated over the past seven decades.
That’s all I have for now. Maybe I’ll look into Christmas next to see if I find any interesting data in that month.