


ST. PETERSBURG, Fla. — As of this writing, Hurricane Dorian is still threatening the Carolina Coast with potential hurricane force wind and storm surge through the end of this week.
But I wanted to take a look back on some of the challenges in the forecast, the long range forecast error, how it compared to historical averages of error, and the messaging to Floridians.
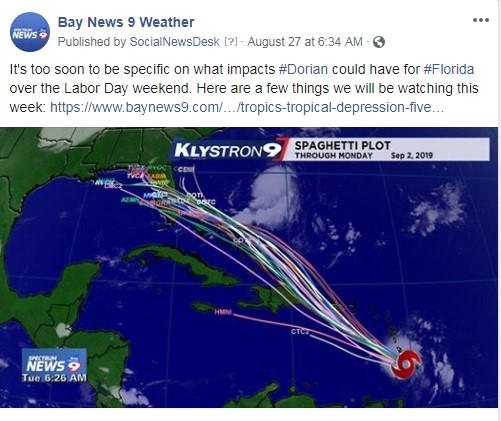
Let's begin with how Dorian began. Dorian, like many late-August systems, began as a tropical wave moving briskly through the Atlantic Ocean. It became a tropical depression and then quickly was classified as Tropical Storm Dorian on Aug. 24 well east of the easternmost islands of the Caribbean.
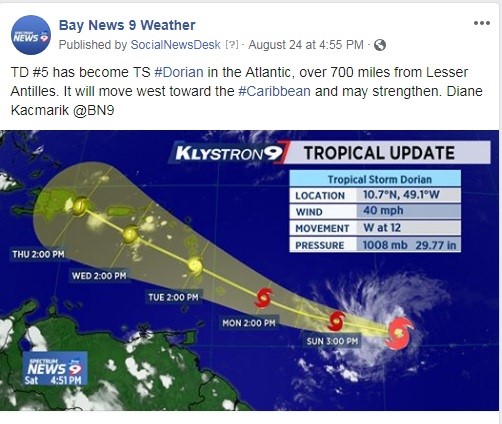
At that time, like with every tropical advisory, important data was sent out. Most people are looking forward to seeing what the track looked like and, of course, the error cone.
As has been discussed many times, the "Error Cone" or "Cone of Uncertainty," is not actually a forecast but merely a graphical representation of average historical error. This is a very important distinction because without proper communication during times of tropical threats, the understanding of the cone often becomes one of the biggest sources of confusion.
Let's talk about those averages. Without getting to far into the weeds about the average error and statistics, basically, the cone works this way: at various forecast points for a tropical forecast, the cone has a constant width (or radius from the forecast point).
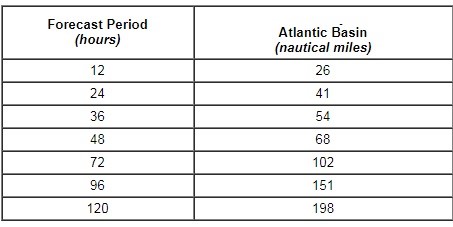
For the purposes of the article, I am going to focus on the longer term forecasts — 96 hours (day 4) and 120 hours (day 5).
This is the time frame when people really begin to pay attention and want to know some details. But as you can see from the chart, the historical average error is rather great at those time periods — 151 miles and 198 miles in all directions from a forecast point can make a huge difference.
In fact, at four days the area of error is over 71,000 square miles. The average hurricane has tropical storm force winds that extend out 50 miles from the center, so an "average" hurricane would have hurricane force winds that cover 7,850 miles.
That means that there would be over 60,000 square miles within the day 4 error cone that would NOT experience hurricane winds at that time.
At day 5, the area of error is 123,000 square miles. That means at that day 5 point in time, over 115,000 square miles would be in the error cone that would NOT experience hurricane conditions.
Now, obviously a hurricane doesn't just magically jump from point to point, so the discrepancy would end up being a little lower. Bottom line, potentially a very large area in the cone would end up NOT experiencing a hurricane or even a tropical storm.
This is based simply on averages. I looked back at the 4 and 5 day forecasts for Dorian from August 24 11 a.m. when it became a tropical storm through August 31, 11 p.m. when the 4-5 day forecasts were finally showing Dorian north of our latitude and no longer a potential threat. I have the data — if you ever want to see it I can post it as well.
The Jog
On August 27 in the morning, Dorian crossed right over St. Lucia in the Eastern Caribbean.
St Lucia, even though small, has some relatively large peaks. Mountainous terrain will typically cause a significant disruption in the structure of a tropical system.
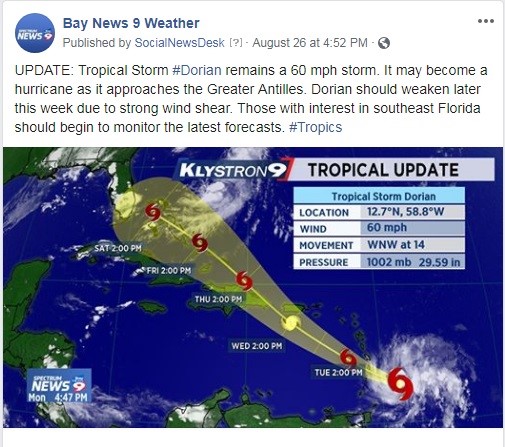
At the time Dorian was a tropical storm, and when it moved over St. Lucia the tropical storm became quickly disorganized. Before that time, the forecast track and the various computer models were in general agreement of a tropical storm potentially become a hurricane moving quickly WNW through the Caribbean toward the Dominican Republic.
There was also an upper level low near Hispanola that would typically cause some wind shear, along with the huge mountains on that island weakening the storm.
Shortly after this time, with Dorian somewhat disorganized, a new center formed about 50 miles to the north northeast of where it was.
That center formed underneath some convection that had been displaced from the "old center," forming a new starting point.
That 50 mile "jog" ended up becoming the most crucial moment in Dorian's eventual history. After a storm takes a significant position change, the previous forecasts can quickly become very bad, if not totally useless.
That was exactly the case here. What looked like a storm heading for a weakening scenario with high wind shear and the mountains of Hispanola became a storm heading to the Virgin Islands east of Puerto Rico and finding a spot in the Atlantic that was VERY favorable for development.
That 50 mile jog caused a 24-hour forecast track error of almost 200 miles. That dramatic shift in the track changed the whole thing.
Before the "jog", the four-day forecast error was 207 miles (average historical error is 151 miles). After the jog the four-day error was only 86 miles, well below the historical average.
At five days, the forecast also improved dramatically. Before the jog, the track error at five days out was 246 miles; after the jog, just 141 miles, putting Dorian's forecast way ahead of long-term averages.
But it is more than that. Before the jog, Dorian would have moved quickly WNW, weakened some and totally would have missed the stall over the Bahamas.
It would have very likely continued WNW right into Florida or even into the Gulf of Mexico as either a tropical storm or low-end hurricane. The shift in position allowed Dorian to miss being broken up over Hispanola or Puerto Rico and allowed it to find a spot in the Atlantic with high oceanic heat content and very favorable upper level conditions underneath the big high pressure area.
It also then led to the high building back in, steering Dorian westward toward the Bahamas and then stalling as the upper level pattern broke down. Finally, it allowed Dorian to find the weakness in the high with the trough moving across the United States that at the time of the jog was in the North Pacific Ocean near Japan.
The challenge in the computer models and the forecast is it takes about 12 to 24 hours after a big shift in position for all the data to be properly consumed by the models.
Challenges in messaging
After we had more confidence in the long-term forecast, communicating the message to Floridians presented a challenge.
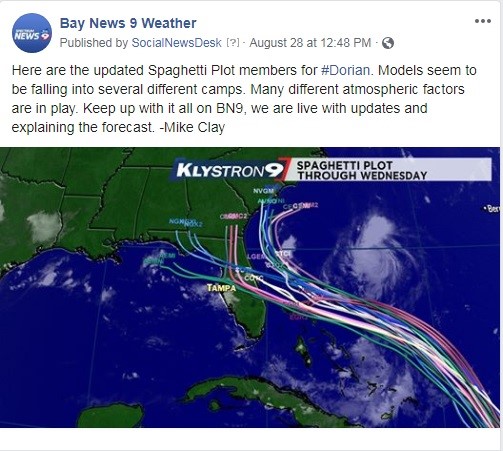
Remember the average historical error at day five of 198 miles? Well, that is wider than Florida. On the image below from a Facebook post on August 28, we were looking at the various computer models indicating the west movement through the Northern Bahamas followed by a turn to the north.
Here we can see that all of the reliable computer models were indicating the turn. The challenge was where the turn was going to take place.
This model plot was out seven days, which obviously would have an even greater average error. But they were all seeing the weakness in the high resulting in the turn north.
When and where was the challenge, as the models were also forecasting the slow down near the N. Bahamas, some even a stall.
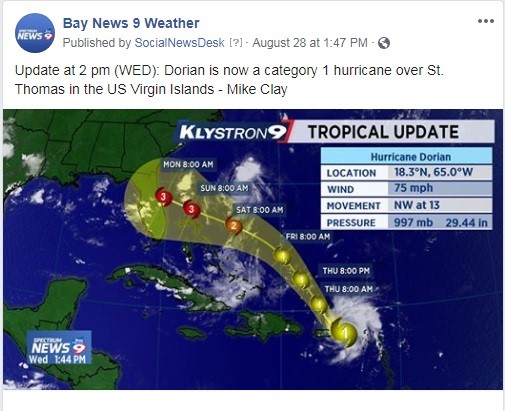
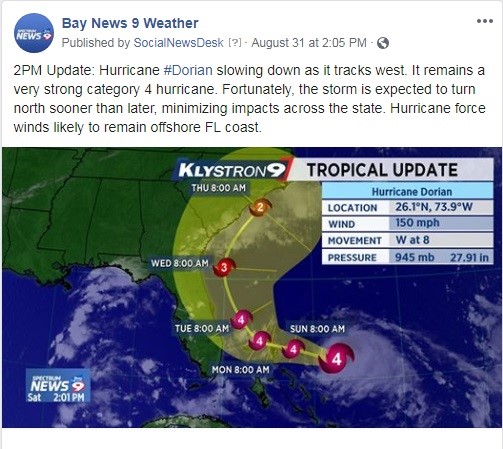
The image that most people were paying attention to at this same time on August 28 was the track. Obviously that forecast out to five days was a potentially scary one for Floridians.
But since the forecast track only goes out five days and the turn north wasn't expected until day six, our eyes and minds just finish the picture. Many thought Florida was going to get hit by a major hurricane.
The problem is, that isn't how a hurricane track necessarily works. That forecast, out to five days, is often a blend of a lot of different factors.
It could be an average of various computer model output. That five-day "forecast point" may very well not even really be a forecast at all, but simply an average position that happens to likely fall within the average historical error.
This became an important time for us as meteorologists, with Floridians hopefully listening to deliver proper messaging.
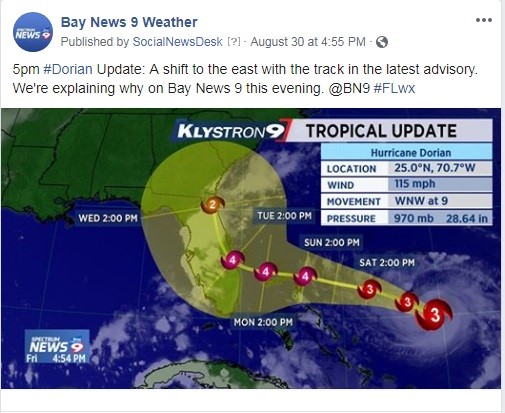
Over the next day or two, we were going to have more information to fine-tune the forecast and the message to Floridians. Below is an image of a Facebook post on August 30, where we were having more confidence in the location of the northward turn.
We were noticing a trend in the models — they were picking up the breakdown of the upper level pattern which would eventually cause the stall over the Bahamas.
But that stall also allowed the trough to "catch up" to Dorian's longitude and turn it northward, east of Florida.
In tropical forecasting, it is important to follow trends.
It is very important for us, as deliverers of extremely important information, to communicate to our viewers and consumers the value of this information. In trying to communicate the information, we just hope that our consumers are following along.
From August 31, we now had almost two and half days of fairly consistent computer modeling indicating a turn east of the Sunshine State, ultimately leading to a minimizing of the effects in Florida.
Sadly, those same conditions led to the ultimate stall of a historically powerful hurricane right on top of the Northern Bahamas.
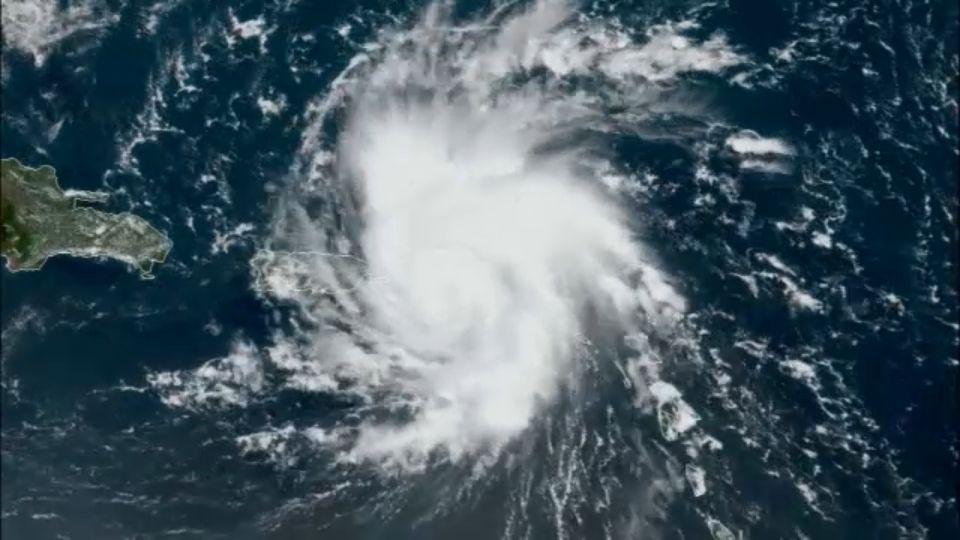
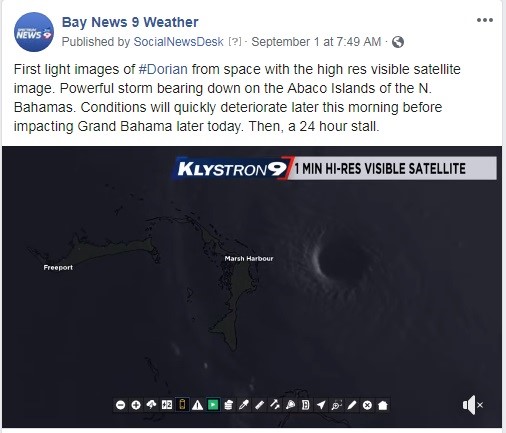
The next two posts on Facebook were from Sunday, Sept. 1, in the morning. When I saw the visible satellite image first thing in the morning, I knew things were going to be horrible in Abaco and then Grand Bahama.
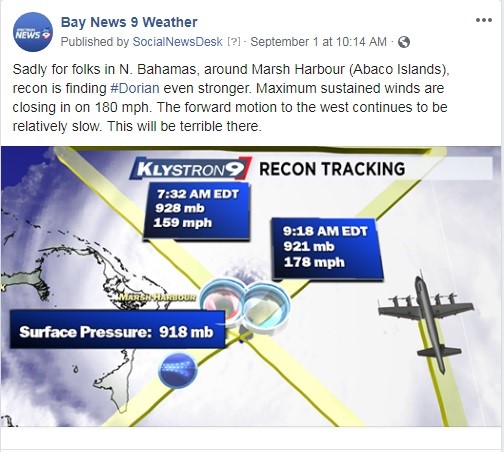
We were seeing a ferocious storm bearing down and slowing down as it approached the island. We were also following recon, which was finding a rapidly strengthening storm.
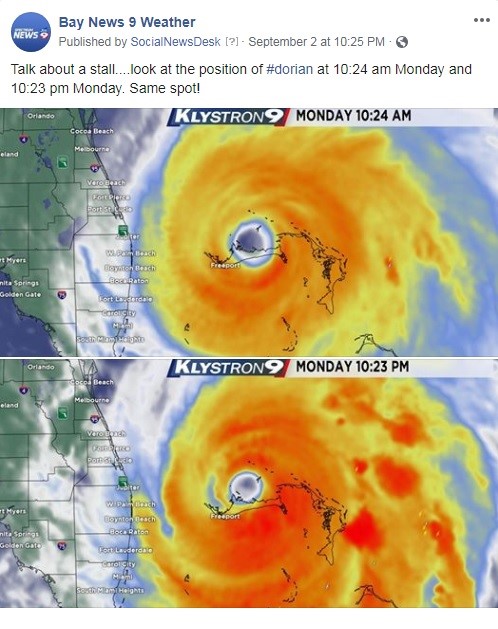
Later that night, Dorian moved to Grand Bahama, where it eventually stopped for over 12 hours.
The worst-case scenario unfolded for Grand Bahama Island. From one sad situation over Abaco on Sunday to another over Grand Bahama on Monday was devastating.
But this prolonged stall gave the trough time to catch up. Once Dorian began moving northwestward to northward on Sept. 3, it was clear that the center was going to pass at a safe distance to the east of Florida.
Since Dorian eventually weakened somewhat by staying in the same place, the weakening system caused an expansion of the wind field. This is why the east coast of Florida ending up with tropical storm conditions despite the storm passing to the east by about 100 miles.
Dorian was an historic storm.